NOTE: Getting Advice About Genetic Testing
I have been spending the past several weeks reviewing my 23andMe genetic testing results that I received at the beginning of this year, and I am now ready to write up my opinions in a blog post. In fact, I have so much to say that I have split the topic into 3 separate posts:
Part I: Getting a (Free) Second Opinion
Part II: The Importance of Non-Genetic Risk Factors
Part III: Using Predictive Models for Genetic Testing
Sunday, February 27, 2011
My 23andMe Results: Using Predictive Models for Genetic Testing
NOTE: Getting Advice About Genetic Testing
There is a big difference between saying that a mutation has a statistically significant association with a trait and saying that a mutation has strong predictive power for a trait. To illustrate this point, I’ll focus on the 23andMe prediction for eye color.
There is a big difference between saying that a mutation has a statistically significant association with a trait and saying that a mutation has strong predictive power for a trait. To illustrate this point, I’ll focus on the 23andMe prediction for eye color.
One of the top 5 traits shown in my trait overview is “eye color.” My eye color was predicted to be “likely brown” (which was an accurate prediction). However, I wanted to look at this report more carefully because I remembered Francis Collins mentioning that 23andMe incorrectly predicted his eye color in “The Language of Life".
I don’t know Francis Collins’ genotype, but I did notice a potential problem when I looked at the section for “Your Genetic Data”
Genotypes for rs12913832 (from 23andMe)
Percent Brown
|
Percent Green
|
Percent Blue
| |
AA
|
85%
|
14%
|
1%
|
AG
|
56%
|
37%
|
7%
|
GG
|
1%
|
27%
|
72%
|
My genotype is AG (shown in red above). I was correctly predicted to have brown eyes, but I actually only have a 56% chance of having brown eyes. This means that the AG genotype is roughly as accurate as a flip of a coin at predicting individuals with brown eye color. In my opinion, I don’t think this should have come up as a top prediction, and I think it probably would have been better to flag this SNP as “not predictive” for this particular genotype.
Now, don’t get me wrong – I don’t think people should only have access to information about their highly predictive SNPs. In fact, I would want to be able to know the frequency of my genotype if it significantly varies for different traits. However, I don’t think information like my predicted eye color should have been something that caught my eye within 5 minutes of viewing my results.
In general, I think it would be useful to give scores to predictions in the same way that stars are given for disease risk. Ideally, it would be nice to provide all the relevant information (such as overall accuracy, sensitivity, specificity. positive predictive value, negative predictive value, etc.) about these predictive models in a table, but in practice it might be better to focus on one or two features for simplicity (especially when dealing with traits that are not binary). In order to distinguish between predictive scores and reproducibility/statistical scores (which I what I would call the 4 star system), perhaps SNPs with a positive predictive value (PPV) greater than 75% get a bronze circle, SNPs with a PPV greater than 85% get a silver circle, SNPs with a PPV greater than 95% get gold circle, and all other SNPS get labeled as "not predictive."
These calculations become trickier when considering diseases that are significantly influenced by multiple SNPs, and this is where building a predictive model (using SVM, CART, etc.) could really be helpful in providing individuals with the most accurate predictions. In fact, these predictive models need not only consider genetic information and can also be used for non-genetic / environmental risk factors like weight, family history, blood sugar, blood pressure, etc. (which I mentioned in my second post).
Unfortunately, there is no absolute best way to build a predictive model using different SNPs (and/or non-genetic information). Based upon my experience, I think regression-based models do a good job of providing probabilities that individuals have a particular trait, and very strong associations should have similar results regardless of which machine learning technique is used. However, I don’t know if a single tool will be appropriate for creating all predictive models, and I’m sure there are some traits for which no good predictive model can be created.
Since there is not a lot of precedence for clinically-relevant predictive models incorporating genetic and non-genetic information, I think 23andMe has a great opportunity to experiment with this for their trait predictions. Since 23andMe is the largest DTC genetic testing company, they will have the most incoming data that they can use as validation sets. If they are worried about how easily individuals will interpret these results, perhaps a separate “experimental” section can be providing this type of result (just like I think it might be best to test these models for the "trait" section before incorporating these results into disease risk and drug response results, which people are more likely to use when making medical decisions). Also, I should acknowledge that I don't know what's going on behind the scenes at 23andMe (for example, I don’t know how 23andMe is currently combining SNPs for disease risk etc.), so this may have be something they have already started to investigate.
Finally, I would like to close this 3-part post by emphasizing that I was generally pleased with my 23andMe results, and I have only provided constructive criticism because I want these results to be as clear and accurate as possible because I think 23andMe has the potential to be an invaluable resource to empower patients to utilize their genetic information to the fullest extent.
My 23andMe Results: The Importance of Non-Genetic Risk Factors
NOTE: Getting Advice About Genetic Testing
When I first saw my 23andMe results, I was very glad to see that each genetic association also had a heritability value. For example, the disease description for Type 1 Diabetes indicates that 72-88% of the disease is determined by genetics whereas the sample description for Type 2 Diabetes indicates that 26% of the disease is determined by genetics (meaning that 74% is determined by environmental factors). In other words, there is a lot more that can be done to prevent the onset of Type 2 Diabetes than Type 1 Diabetes.
When I first saw my 23andMe results, I was very glad to see that each genetic association also had a heritability value. For example, the disease description for Type 1 Diabetes indicates that 72-88% of the disease is determined by genetics whereas the sample description for Type 2 Diabetes indicates that 26% of the disease is determined by genetics (meaning that 74% is determined by environmental factors). In other words, there is a lot more that can be done to prevent the onset of Type 2 Diabetes than Type 1 Diabetes.
I was also glad to see a “What You Can Do” section describing what actions high risk individuals could potentially take to prevent or manage their disease.
Although these two steps may represent the best way to currently convey this information for most associations, I think it would really help if non-genetic factors could directly be incorporated into risk calculations.
For example, I noticed that one of my Promethease results indicated that a long history of high blood sugar would increase my risk for CAD from 1.7x to 7x (for SNP rs1333049). If 23andMe could incorporate information about my medical history directly into my risk calculations, then I think that could make the predictions much more powerful.
In addition to providing more precise risk assessments, I think incorporating non-genetic information could also actively help individuals manage their health. For example, if I knew that losing 30 pounds would cut my risk of developing a particular type of cardiovascular disease by 50% based upon a personalized quantitative model, then I would probably be more inclined to lose that weight than if I simply knew that eating right and exercising was generally a good idea.
That said, I think there are some fundamental changes that may need to take place before such an idea could be implemented (assuming science has progressed to the point where we could provide such models for most diseases). First, I think users need a more dynamic way to record their medical information in 23andMe. By this I mean that users need to be able to update their medical information rather than fill out surveys at one point after they create their account. For example, I responded that I didn’t have any serious illnesses (like cancer, cardiovascular disease, etc.), but I’m sure my answers to those questions will change over the course of my life.
In order to integrate both genetic and environmental risk factors into risk calculations, it may also be helpful to think about other ways to present genetic testing results (which I discuss in greater detail in my third post on predictive models).
My 23andMe Results: Getting a (Free) Second Opinion
NOTE: Getting Advice About Genetic Testing
In order to get an idea about how well the 23andMe risk calculator agrees with other algorithms (when using the same exact same SNP data), I searched for other tools that I could use to analyze my genetic data.
In order to get an idea about how well the 23andMe risk calculator agrees with other algorithms (when using the same exact same SNP data), I searched for other tools that I could use to analyze my genetic data.
For this post, I have compared my risk assessments from 23andMe to those provided by Promethease (which uses the information available in SNPedia). I also played around with the free version of Enlis Genome (Personal Edition), but I found the GUI to be a little buggy and they didn’t automatically prioritize risk assessments (unlike 23andMe and Promethease). So, this post will focus only on comparing my 23andMe assessment with my Promethease assessment.
To be fair, I should point out that I would not necessarily expect 100% concordance between my 23andMe and Promethease results for various reasons. For example, the “magnitude” score from promethease is a subjective measure, and the curation methods are different for these two tools. However, I think such a comparison will still be useful because it will still be encouraging to see any predictions that are shared by both tools, and I think both of these tools provide useful information since there is no “standard” way to combine all possible associated SNPs associated with a particular disease.
I will focus on my increased disease risks, but the same principles could be applied to decreased disease risk, drug response, or any other trait.
All Diseases with Increased Risk
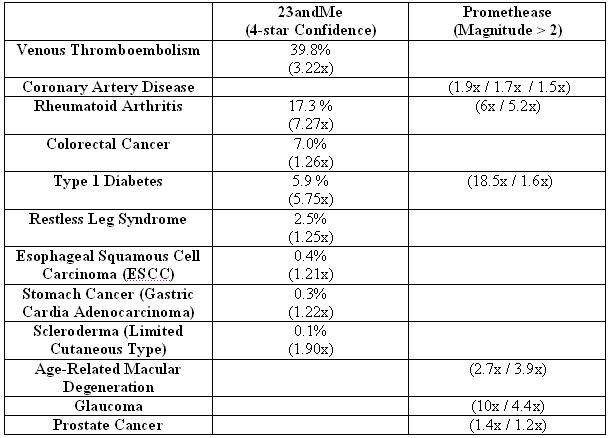 |
NOTE: Percentages refer to percent of individuals with my genotype that have a particular disease, and the relative risk compared to average percentage is given in parentheses. Percentages are not given for Promethease results because the percentage provided in the summary report refers to the population frequency of the SNP and not the percent of individuals with that SNP that will have a particular disease. Only Promethease results with clearly defined disease names and relative risk values were considered. Promethease cutoff chosen based upon change in color from pink to red in summary report (and also the number of associations listed at this threshold). 23andMe risk assessment was recorded on 2/26/2011. Promethease report was generated on 1/27/2011. Multiple values are provided for Promethease but not 23andMe because promethease provides risk assessments for individual SNPs whereas 23andMe provides a single risk value for each disease.
|
Overall, I thought that there was pretty good agreement between the two methods. This may not be apparent from the table above, but that is because my list of “higher importance” SNPs is considerably smaller but with greater overlap. For example, I would have ideally preferred to look at SNPs with a 1.5x increase in risk and an absolute risk greater than 50%. The absolute cut-off of 50% is because I would prefer to look at SNPs where I am more likely to get the disease than not get the disease. The 1.5x (or 50% increase in risk) is a somewhat arbitrary cutoff that is loosely based upon my microarray data analysis experience. Since no SNPs meet both of these criteria, I chose to look at those with a greater than 1.5x relative risk and greater than 5% absolute risk (which, in my opinion, is still quite low). Now, take a look at my more subjective SNP list.
“Higher Priority” SNPs

Now, 2 out of the 3 SNPs have similar predictions. Although there wasn’t a high magnitude SNP in promethease for venous thromboembolism, this could be because I subjectively considered this disease to be less well known than arthritis or diabetes, so I figured less popular diseases may have lower magnitude scores. For this reason, I decided to look into what SNPs are used by 23andMe and promethease to determine venous thromboembolism risk. I also checked the Genome-Wide Association (GWAS) Catalog to try and get a idea which SNPs are the best established (according to the US National Human Genome Institute).
SNPs Associated with Venous Thromboembolism Risk
23andMe
|
Promethease
|
GWAS Catalog
| |
rs6025
|
Yes
|
Yes
|
No
|
i3002432
|
Yes
|
No
|
No
|
rs505922
|
No
|
Yes
|
Yes
|
NOTE: Promethease lists 19 SNPs associated venous thrombembolism. In order to simplify the table (and avoid listing some potentially inaccurate and/or low-confidence associations), I have only listed SNPs listed by 23andMe or the GWAS Catalog.
Now there is agreement between the 23andMe and Promethease results because both tools indicate that I have a mutation in rs6025, which results in an increased risk of developing venous thromboembolism. However, I think it is worth pointing out that the results are not quite as clean as they could be. For example, this SNP was not listed in the GWAS Catalog, and I couldn’t determine the dbSNP annotation for i3002432 (so it was relatively hard for me to cross-reference this result with other databases).
Another topic that is worth considering is family history. Before I saw my results, there were 3 diseases that I wanted to check due to family history: type I diabetes, type II diabetes, and macular degeneration. Thus, it was interesting to see type I diabetes come up in both reports. Although I doubt that I will get type I diabetes (since the absolute risk is low and this disease usually appears during childhood), this information may still be useful if these mutations have other affects and/or increase the likelihood of children inheriting type I diabetes.
On the other hand, I didn’t see results indicating a increase in risk for type II diabetes and there were some conflicting results about macular degeneration. Of course, family history is not a gold standard, and I may very well never develop type II diabetes or macular degeneration. However, I think it is important to think carefully about ambiguous or uncertain results. For example, this could be done by comparing SNP association to family history as well as considering both genetic and non-genetic risk factors for disease (the later is the topic of my second post).
Subscribe to:
Posts (Atom)


